Several online sources provided eclipse maps for the 2024 April 8th total solar eclipse. All these maps show the location of the umbral shadow path limits. Close inspection reveals that the location of the limits is different in all these maps. If we look at the eclipse northern edge, these differences can be of the order of a couple kilometers. For most eclipse observers located well within the totality path, these differences are inconsequential (although they have an impact on the duration of totality). But for observers located very near the eclipse limits, these differences can easily change the predicted eclipse type observable from a specific location or noticeably alter the predicted duration of totality.
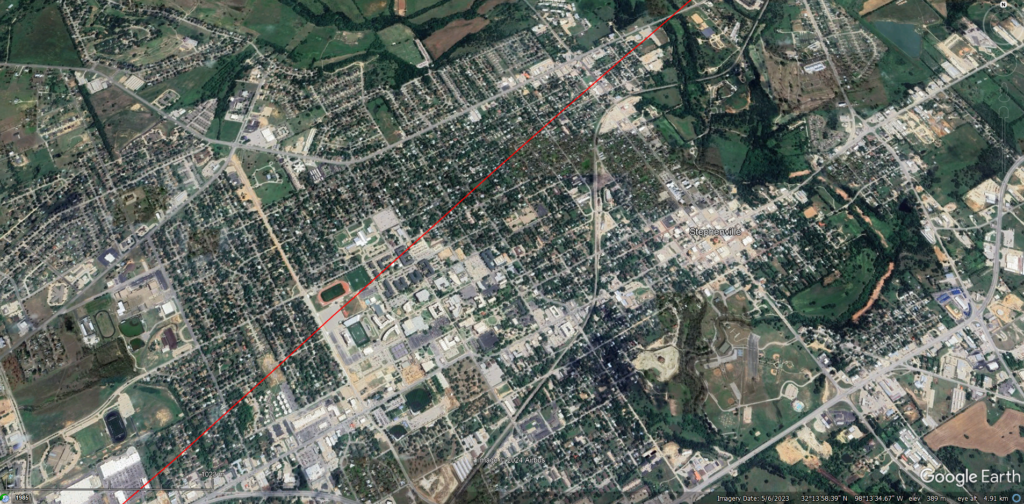
The following image displays the location of the eclipse northern limit as it bisects Stephenville, TX (USA). Here is the subset of eclipse map sources we considered: in green timeanddate.com, in yellow xjubier.free.com, in magenta eclipse2024.com, in blue svs.gsfc.nasa.gov and in orange besselianelements.com. The yellow dashed line is Xavier Jubier’s northern limit location inferred by looking at where the lunar limb corrected totality duration is 0s.
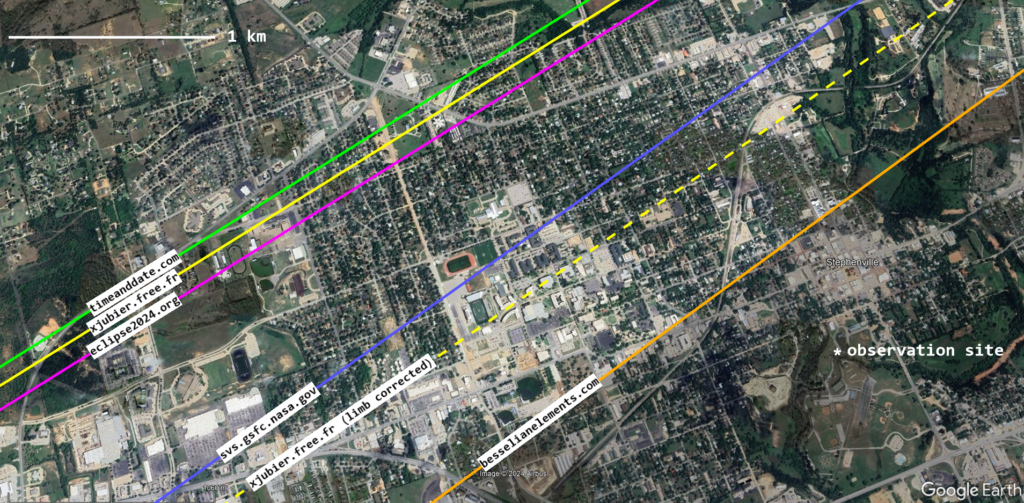
Figure 1: Comparison of the 2024 April 8th total solar eclipse northern limit location as predicted by various sources for Stephenville, TX (USA).
The northern limit depicted in orange is the one published on this blog a week and half before the eclipse and initially reported by eclipse journalist Jamie Carter on forbes.com. The location of this limit is based on a very precise eclipse computational model developed by the John Irwin, a member of the Besselian Elements Team, the team behind this blog. Technical details of the map are described here.
Only experimental observations can allow assessing which of these limits came closer to represent reality on eclipse day. Directly establishing the location of the limit is an arduous task experimentally, as visually discriminating between being in totality and not being in totality is likely to become very challenging the closer the observer is to the limit. We can indirectly assess the goodness of an eclipse limit prediction by actually timing the eclipse contact times and then comparing the experimental measurements to the contact times predicted by the various models.
The Besselian Elements Team observed the eclipse from Stephenville City Park: the observing location is marked by a star in Figure 1. We were extremely lucky to be able to observe totality in clear blue sky (see this post). Among the data collected at that observation site were manually timed contact times.
To facilitate the timing task, we built a “UTC Event Timer”. This device is based on an Arduino board and an Arduino shield with GPS and SD Card modules. Once in operation, the device continuously monitors the 1PPS signal from the GPS to provide an accurate UTC time base. The device has a button that, when pressed, collects the current UTC time and saves it to the SD Card.
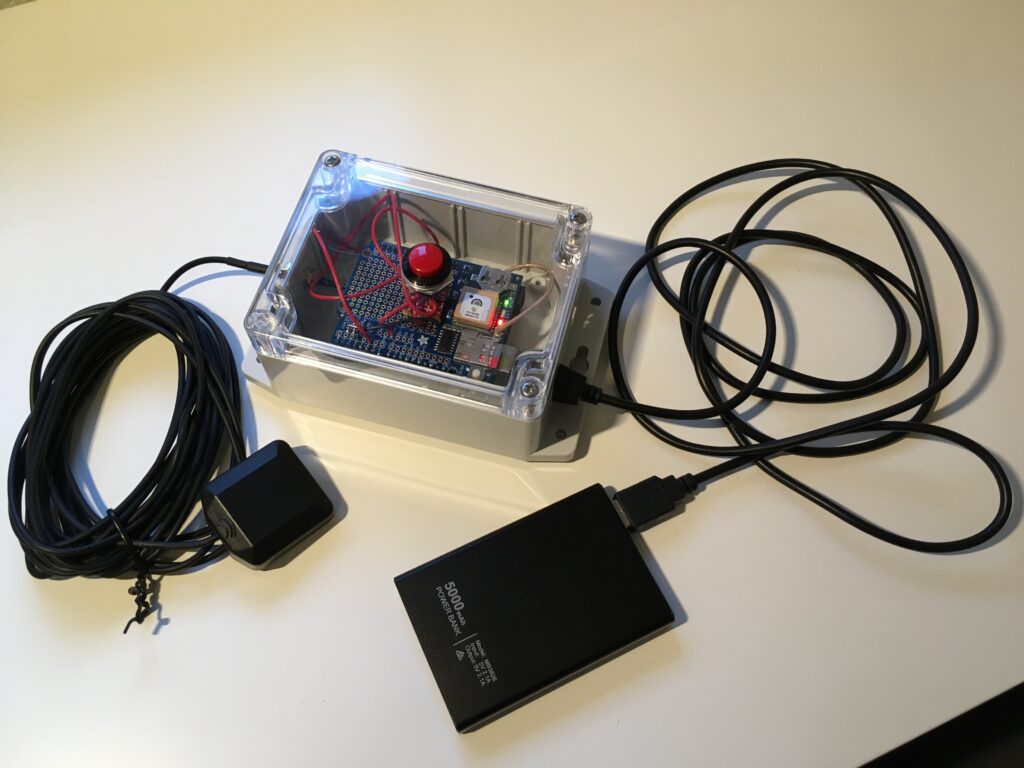
Figure 2: The UTC Event Timer device.
The timing was performed by visually looking at the eclipse through diffraction grating spectacles. These spectacles are cardboard glasses (very similar to eclipse glasses) but with a transparent plastic film etched with microscopic ribs. They enable the observer to see both the direct image of the eclipsed Sun and the spectrum of its light, the so-called “flash spectrum”. We used spectacles manufactured by Rainbow Symphony with 1000 lines/mm.
If you are not familiar with the flash spectrum, you can get up to speed by reading this post on this blog. The advantage of observing the flash spectrum to time contact times is that different light sources (photosphere, mesosphere, chromosphere, corona) are separated geometrically, while all these sources of light are basically in the same place, if the eclipse is observed directly, where the last Baily’s bead before C2 and the first Baily’s bead after C3 occur.
“Totality” is defined as the period when the photosphere is fully occulted by the Moon. Hence, second and third contacts are the times when the photospheric continuum vanishes and reappears, respectively, in the flash spectrum. The experiment was rather simple: observing the flash spectrum through the diffraction grating spectacles just before the onset of totality and pushing the UTC Event Timer button when the photospheric continuum vanished. And pushing the button again when the photospheric continuum reappeared.
This is what we measured experimentally:
C2: 18h 39m 06.6s UTC
C3: 18h 39m 20.3s UTC
duration: 13.7 s
The contact times are 13h 39 06.6s and 13h 39 20.3s if expressed in local time. Because these are manual measurements, they are affected by reaction time and by how easy it is to detect the disappearance or reappearance of the photospheric continuum. The flash spectrum was visually very sharp and well resolved, and we would estimate that the experimental error on the duration of totality is probably of the order of just a couple of seconds, no more.
The following table reports the contact times and totality durations predicted by various online source. As a sanity check, we can see that the predicted duration of totality at the observing site decreases the closer the predicted northern limit is to the observing site.
| SOURCE | C2 | C3 | Duration |
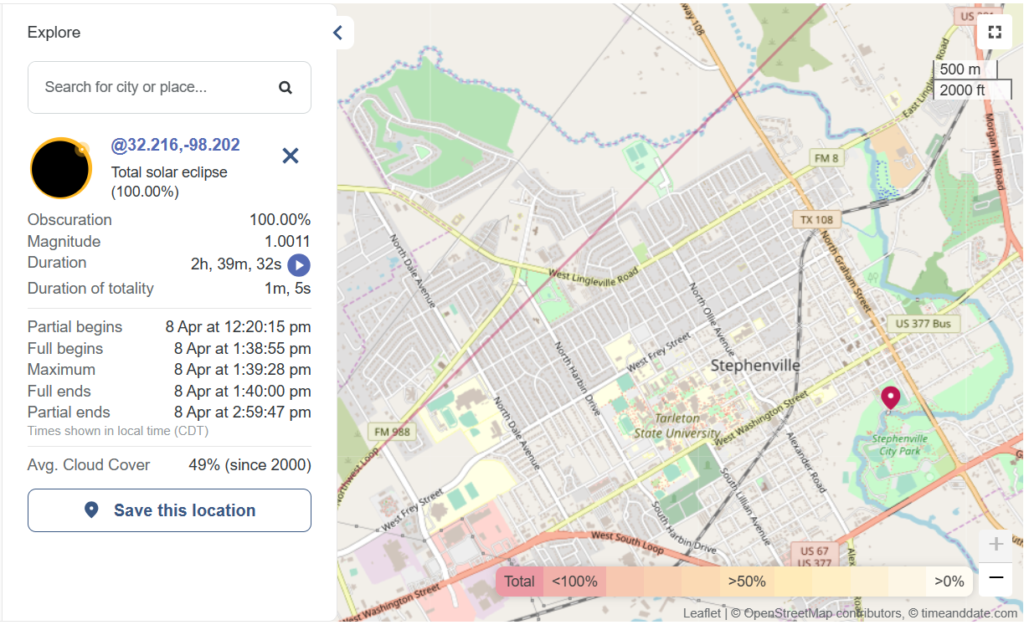
| timeanddate.com | 13h 38m 55s | 13h 40m 00s | 65 s |
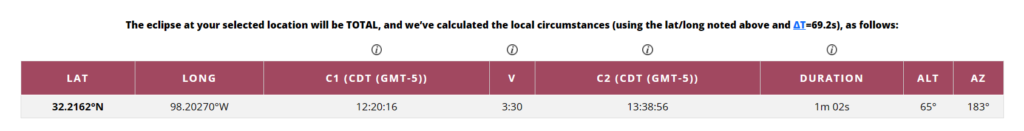
| eclipse2024.org (local circumstances) | 13h 38m 56s | 13h 39m 58s | 62 s |
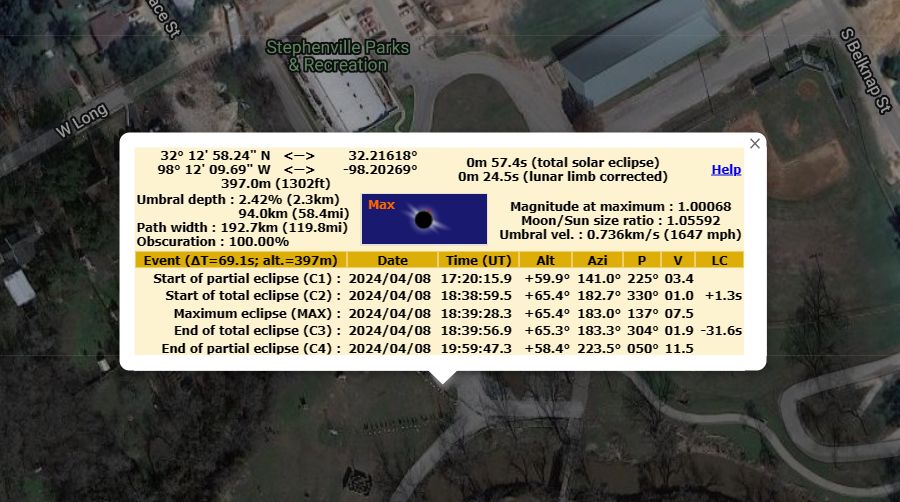
| xjubier.free.fr | 13h 38m 59.5s | 13h 39m 56.9s | 57.4 s |
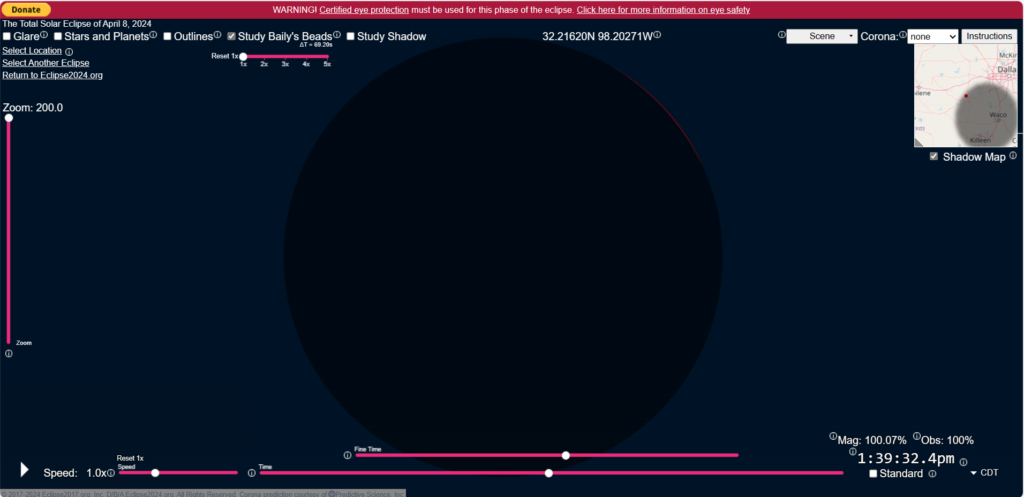
| eclipse2024.org (inferred from simulator) | ~13h 38m 56s | ~13h 39m 32s | ~36 s |
| xjubier.free.fr (lunar limb corrected) | 13h 39m 00.8s | 13h 39h 25.3s | 24.5 s |
| besselianelements.com (John Irwin) | 13h 39m 06.1s | 13h 39m 19.0s | 12.9 s |
The prediction best reproducing the observed totality duration is the Besselian Elements Team’s one by John Irwin, whose predicted northern limit is depicted in orange in Figure 1, and it is indeed the closest to the observing site. Accounting for experimental uncertainty, John’s predicted contact times closely agree with the measured ones.
The differences between all other surveyed predicted totality durations and the observed one are statistically significant, often amounting to several tens of seconds, well beyond the level of experimental uncertainty. It can be argued that a manual measurement is not very scientific. We can remark that we have performed the same measurement during the 2023 April 20th annular-total eclipse in Cape Range National Park, WA (Australia) with similar success, as described in the following publication.
Very near the eclipse limits, the dependence of the duration of totality on the distance to the limit is very strong. Even walking away from the limit for a few minutes and going several hundreds of meters further inwards into the umbral shadow path will detectably increase the duration of totality. So, we believe this experiment to be relevant to assess the goodness of the various eclipse models.
We will conclude with an anecdote. On eclipse day, a young man parked next to our car and set up his telescope. We chatted with him, and he said that he had driven for an hour or so to move away from the clouds and selected Stephenville City Park because totality was going to last about a minute. We had to break the news to him that we strongly believed that totality would not last more than 15s… He was a bit disappointed. But, in the end, the sky was blue, the eclipse was nothing short of spectacular, with an amazingly long Baily’s bead after third contact, and the whole experience was a blast. He was super happy afterwards (like we were)!
Appendix: Data Sources
Data were gathered by navigating through the map to pinpoint the location of the observation site.
Data were gathered by navigating through the map to pinpoint the location of the observation site.
The main screen listing the eclipse local circumstances provides unadjusted contact times. To obtain limb corrected contact times, the times of C2 and C3 need to be amended by the amount in column “LC” (limb corrections): C2 + 1.3s and C3 – 31.6s. The very substantial limb correction at C3 is due to a very deep lunar valley complex at the point of contact.
Data were gathered by navigating through the map to pinpoint the location of the observation site. These are the provided contact times and duration of totality.
This site also provides a very nice simulator that allows studying Baily’s beads. Second contact was inferred from the simulation by looking for the disappearance of the last Baily’s bead. The result is only approximate.
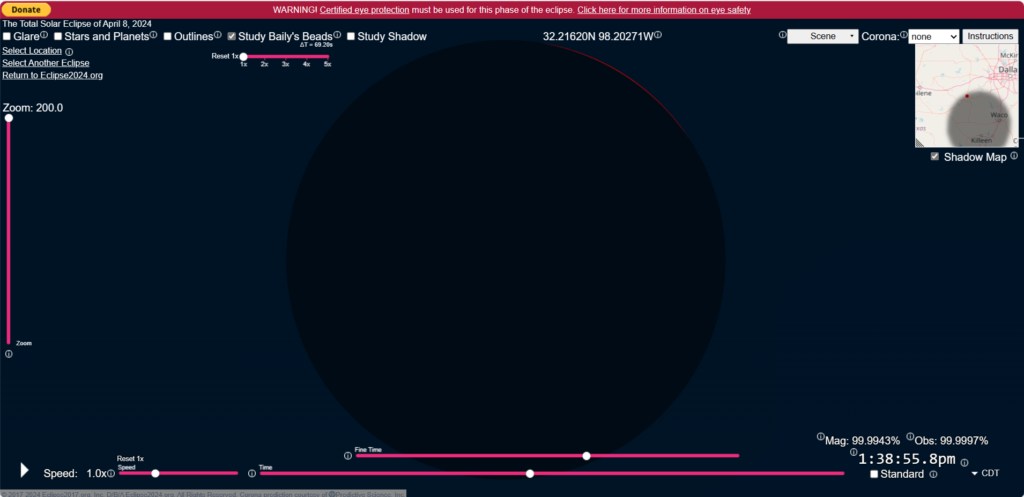

Similarly, third contact was inferred from the simulation by looking for the reappearance of the first Baily’s bead. The result is only approximate.

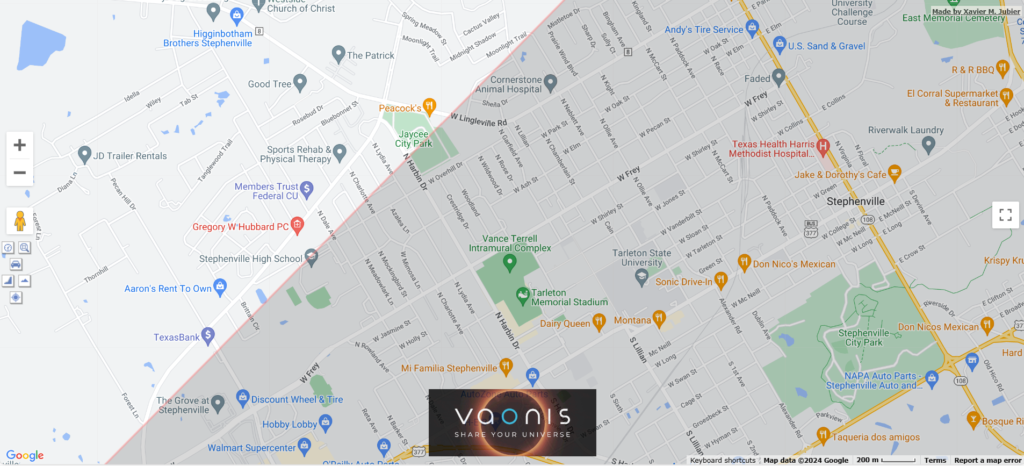
NASA provides Google Earth KML file of the eclipse path. We have used the “upath_hi” file to get the high-resolution map. Unfortunately, no contact times are available.
NASA also provides an interactive map of the eclipse at the following website. The resolution is limited, and it is not possible to zoom in sufficiently. Moreover, the durations of totality obtained by clicking the map are not dynamic: we think there is a static database of durations per city/township behind the map.