Many observers in Northern Texas, and elsewhere, reported that cloud cover decreased on the lead up to totality during the recent total solar eclipse. Some places started with overcast skies, but the cloud cover became broken up allowing glimpses of totality in the gaps where clouds were thinner. Some other places started with broken clouds, the clouds thinned, and larger and larger gaps appeared among them, again allowing observation of totality.
As a solar eclipse progresses, less and less solar irradiation reaches the top of the atmosphere leading to complex effects on the clouds, if present. The progressive loss of solar irradiation causes ground temperatures to decrease and tends to affect cumulus clouds (which are low level clouds): they tend to dissipate, and their formation is suppressed. Usually, higher altitude clouds do not tend to be affected as much or not at all. This is a well-documented meteorological effect of major eclipses.
We observed the 2024 April 8th total solar eclipse in Stephenville, TX (USA) from ca. 0.5km from the umbral shadow path northern limit, and we collected data that, we think, is related to the effect of eclipse cooling on the clouds. Documenting this effect was not our primary objective, but post eclipse analysis made us think about it.
What were the sky conditions during the first partial phase of the eclipse? We were very lucky, as in Stephenville the sky was mainly blue with small irregular and filamentous clouds. At times, clouds were more organised, but as the eclipse was getting closer to totality, the sky cleared up entirely. This sequence of images depicts the sky quality improvement progression.
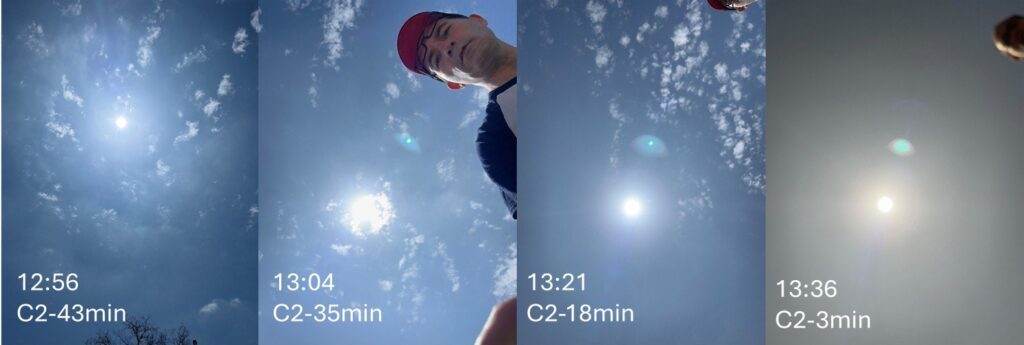
Figure 1: a sequence of images, time-stamped relative to second contact C2, documenting the sky conditions in Stephenville, TX.
The sky is cloudless in the fourth pic taken just 3 minutes before second contact, and the sky looks grayish as ambient light had already darkened substantially.
We also collected ambient light level data using a homemade logger, and this can be used as a proxy for sky conditions. The logger has a photodiode as its sensing element, and it is based on an Arduino board, an Arduino shield with GPS and SD card modules and an analogue-to-digital converter. The photodiode is a Hamamatsu S16838-01MS and its response is linear. The logger recorded ambient light levels on the SD card, mainly direct sunlight, but also diffuse light. The recording speed was ca. 4Hz.
The following graph displays the signal recorded by the photodiode through time, from 1 hour before totality to 1h after totality. The photodiode was horizontal, so, without the eclipse and with cloudless sky, the direct sunlight level would slightly change over the two hours due to changing Sun’s altitude. The Sun’s altitude went from 62 degrees at the start of the recording, to 65 degrees at totality to 61 degrees at the end of the recording. Overall, the effect is minor.
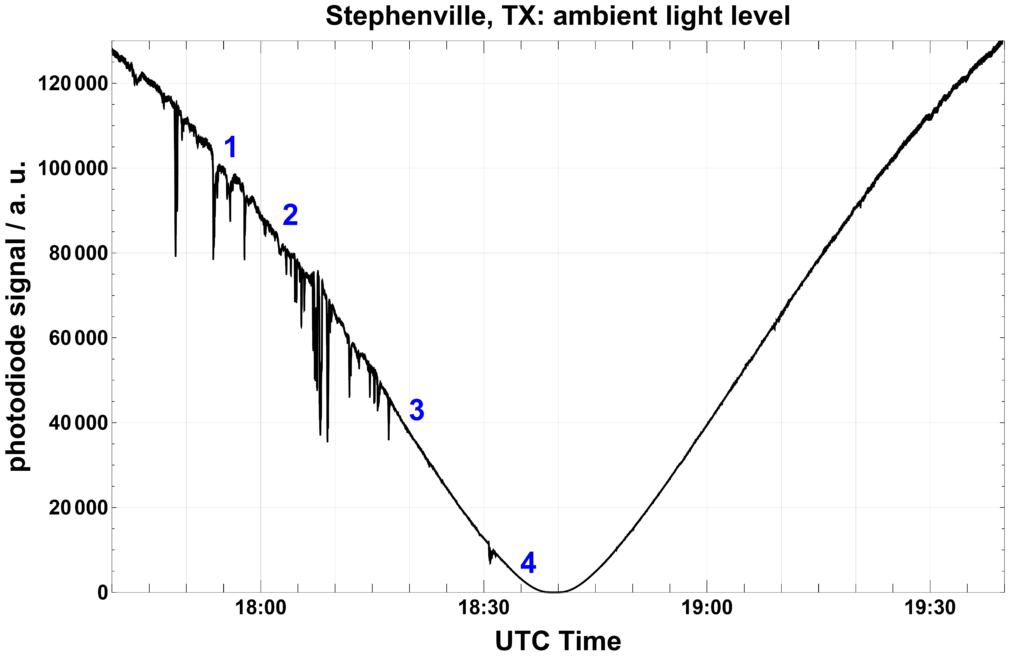
Figure 2: Ambient light levels recorded by a photodiode logger over the course of 2 hours centered around totality.
Obviously, the main driver of ambient light levels is the ongoing eclipse. Ambient light levels dropped by about 2 orders of magnitude (from ca. 100000 to ca. 1000) from the start of the eclipse to 2-3 minutes before second contact. And then, as the following graph shows, by another 2 orders of magnitude (from ca. 1000 to ca. 10) in the last two minutes before totality!
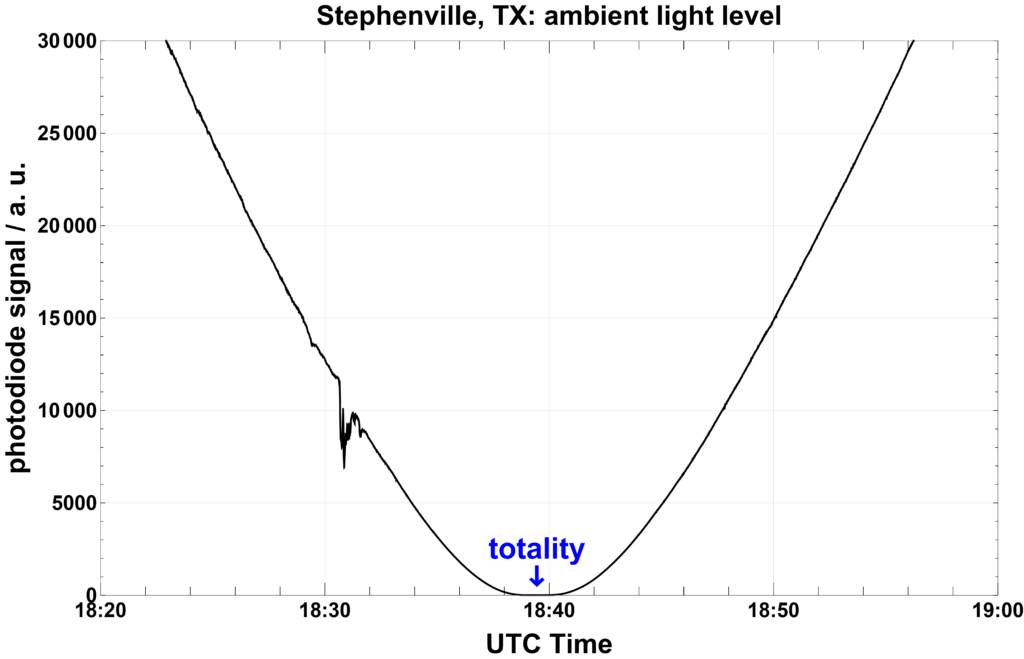
Figure 3: Ambient light levels around totality.
As we said, ambient light levels are a proxy for sky conditions around the Sun: any clouds, even very tiny, passing in front of the Sun will be recorded as a dip, more or less deep, in the photodiode signal. Figure 2 shows many dips caused by passing clouds. The number 1, 2, 3 and 4 indicates the times when the four images in Figure 1 were taken. This shows that the passage of even the smallest of those flimsy irregular clouds seen in the first three images of Figure 1 were recorded in the photodiode signal.
For the first 40 minutes of partial phase there were clouds, sometimes denser. After that, the depth of the visible dips in the photodiode signal rapidly became less pronounced, and then the dips basically disappeared. There was a tiny disturbance 4-5 minutes before totality, as seen in Figure 3, but then nothing for pretty much the next hour. The photodiode signal did not record the passage of any clouds from just before totality to basically at least half an hour after totality.
We were indeed extremely lucky to have a perfect blue sky for totality. But the photodiode signal made us think of the effect of eclipse cooling. The sky conditions were already quite favourable at the start of the eclipse partial phase but became very rapidly ideal after 2/3 of the way into partiality and stayed so for a good while afterwards. By then the ambient temperature had already noticeably dropped. We know that eclipse cooling has a delayed effect on the temperature, and that would correlate well with the sky conditions remaining ideal for a while after totality.
We cannot be 100% certain that the rapid dissipation of all clouds was entirely due to eclipse cooling because the clouds visible in Figure 1 might not be just cumulus clouds, but it seems a rather peculiar occurrence that clouds just vanished from the sky. The photodiode signal could only detect clouds passing in front of the Sun, but we can attest that the sky was cloudless pretty much in every direction just before and after totality.
Addendum
We asked eclipse meteorologist Jay Anderson (eclipsophile.com) about eclipse cooling and the clouds disappearance in Stephenville, and he was very kind to give his take on it, and he also provided some very interesting satellite data. Thank you Jay!
Here is Jay’s comment:
The dissipation of small cumulus as the eclipse shadow approaches is well known and typically begins about half-way between first and second contact. I first encountered in in 1983, in Indonesia. In the visible-light satellite animation that I’ve attached (Stephenville’s approximate position is the tiny yellow dot), you can see the cumulus dissipating as the shadow arrives and rebuilding afterward. Your observation site was on the extreme edge of a larger area of cumulus that later spread over you after the eclipse.
In the infrared animation, which shows high cloud best, you can see a vague white shadow pass over Texas as the shadow crosses. This is best seen in the clear areas where the ground is visible. The turn to a gray tone is caused by the reduction in infrared light as the ground cools. It’s subtle, but easily seen in the animation. The high-level cloud is a very “busy” layer, with many patches of cirrus moving, forming, and dissipating in the strong jet-stream flow. The large thunderstorm developing to your east may have had some influence on cloud at high levels, but it seems too far away to have affected your part of the track. As far as I can determine, the eclipse had no effect on the high cloud and on the thunderstorm development.
Here are the two satellite videos (satellite imagery credit: NASA), the first one in the visible and the second one in the infrared. The location of Stephenville is marked by a yellow dot.